“Arbitrage is the practice of taking advantage of a price difference between two or more markets”
Definition
Crypto currencies are bought and sold on different exchanges. Basically it is like a bank, but for crypto. The price is not allways exactly the same on 2 exchanges, as shown here. It is thus possible to buy a crypto where the price is low, and sell it instantly where the price is high to realize a gain without taking any risk.
Consider the following situation as an example:
- step 1 - the price of etherum is 700 euros on Kraken (exchange 1). I take 700 euros and buy 1 Etherum
- step 2 - I send this etherum to Bitstamp (exchange 2)
- step 3 - I sell the etherum on Bitstamp, but the price is different: 750. Thus I now have 750 euros, which is a gain of 50 euros.
- Again
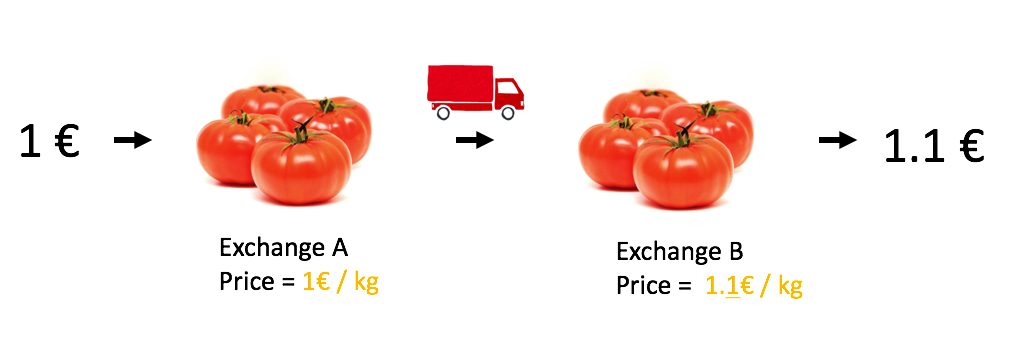
Here is an illustration using tomatoes, buy at 1 euro / kilo, sold at 1.1 euros / kilo. The idea is to do the same, but instantly and using crypto instead of tomatoes.
Limitation
Of course the naive example described above encouters several limit in real life. Here is a list of them:
Price differences are rare: you can read the dedicated page where I quantified these differencesTransaction have fees: each time you buy, sell or transfer crypto, fees apply. In most of the exchanges there is a 0.25% fee to buy and sellPrices evolve quickly: buy the time you discovered a price discrepancy, prices are already different. This is called Slippage risk. Doing arbitrage without an automatic bot is impossible.Crypto transfer takes time: you can buy and sell crypto instantly, however it takes time to send it to another exchange or to/from your bank accountConcentration risk: if it is always the same exchange that is more expensive, all your money will ends up in it. You won’t be able to do any new transaction until you rebalance funds.Price volatility: let’s say you have a efficient arbitrage algorithm that makes 1% a day. If the crypto price drops down when you have some, your loss will probably higher than your gains.
The plan
Most of the limitations above do not have any workaround. However it is possible to change a bit the arbitrage strategy to avoid transfering funds from one exchange to another. Here is how it works:
- step1 - crypto is cheaper on exchange 1 than on exchange 2. I buy some crypto on it.
- step2 - in the same time, I sell exactly the same amount of crypto on exchange 2.
- step3 - wait for a new price differences in the other side.
- step4 - perform exactly the same think but in the other side.
- Again
library(tidyverse)
library(gganimate)
library(tweenr)

# Initial data
init <- data.frame(
  x = c(1,4,1,4),
  y = c(3,3,1,1),
  value = rep(100, 4),
  tot = rep(200,4),
  tot_crypto = rep(200,4),
  arrow1 = rep(0,4),
  arrow2 = rep(0,4),
  arrow3 = rep(0,4),
  arrow4 = rep(0,4)
)

# A function to trade data
trade1 <- function(don){
  totrade=50
  gain=1.8
  don$value[1] <- don$value[1] - totrade
  don$value[2] <- don$value[2] + totrade
  don$tot <- don$value[1] + don$value[3]
  don$tot_crypto <- don$value[2] + don$value[4]
  don$arrow1 <- 1
  don$arrow2 <- 0
  don$arrow3 <- 0
  don$arrow4 <- 0
  return(don)
}
trade1bis <- function(don){
  totrade=50
  gain=1.8
  don$value[3] <- don$value[3] + totrade*gain
  don$value[4] <- don$value[4] - totrade
  don$tot <- don$value[1] + don$value[3]
  don$tot_crypto <- don$value[2] + don$value[4]
  don$arrow1 <- 0
  don$arrow2 <- 1
  don$arrow3 <- 0
  don$arrow4 <- 0
  return(don)
}
trade2 <- function(don){
  totrade=50
  gain=1.8
  don$value[3] <- don$value[3] - totrade
  don$value[4] <- don$value[4] + totrade
  don$tot <- don$value[1] + don$value[3]
  don$tot_crypto <- don$value[2] + don$value[4]
  don$arrow1 <- 0
  don$arrow2 <- 0
  don$arrow3 <- 1
  don$arrow4 <- 0
  return(don)
}
trade2bis <- function(don){
  totrade=50
  gain=1.8
  don$value[1] <- don$value[1] + totrade*gain
  don$value[2] <- don$value[2] - totrade
  don$tot <- don$value[1] + don$value[3]
  don$tot_crypto <- don$value[2] + don$value[4]
  don$arrow1 <- 0
  don$arrow2 <- 0
  don$arrow3 <- 0
  don$arrow4 <- 1
  return(don)
}


# Loop to do several transaction
mylist <- list(init, init, init)
tmp <- init
num <- 1
# i is the number of cycle
for(i in 1){
  #step1:
  num <- num + 1 ; tmp <- trade1(tmp) ; mylist[[num]] <- tmp

  #step2
  num <- num + 1 ; tmp <- trade1bis(tmp) ; mylist[[num]] <- tmp

  #step3
  num <- num + 1 ; tmp <- trade2(tmp) ;  mylist[[num]] <- tmp

  #step4
  num <- num + 1 ; tmp <- trade2bis(tmp) ; mylist[[num]] <- tmp
  }
mylist

# Use tweenR
tf <- tween_states(mylist, tweenlength = 0.01, statelength = 0.1, ease = c('cubic-in-out'), nframes = 100)
tf


# Animation
p <- tf   %>% ggplot(aes(x=x, y=y, size=value, frame=.frame)) +
  theme_void() +
  geom_point( aes(color=paste(x,y))) +
  scale_color_manual(values=c("#69b3a2", "purple", "#69b3a2", "purple")) +
  scale_size_continuous(range=c(1,30)) +
  theme(legend.position="none") +

  # Quantity of money
  geom_text( aes(label=round(value,0), x=x, y=y-0.5, color=paste(x,y)), size=6) +

  # Exchange names
  geom_label( x=-1, y=3, label="Exchange 1", color="purple", size=5) +
  geom_label( x=-1, y=1, label="Exchange 2", color="#69b3a2", size=5) +

  # Arrows: up right / bottom left / bottom right / up left
  geom_segment(aes(alpha=arrow1), x=1.8, xend=3.2, y=3, yend=3, size = 1, arrow = arrow(length = unit(0.5, "cm"))) +
  geom_segment(aes(alpha=arrow2), x=3.2, xend=1.8, y=1, yend=1, size = 1, arrow = arrow(length = unit(0.5, "cm"))) +
  geom_segment(aes(alpha=arrow3), x=1.8, xend=3.2, y=1, yend=1, size = 1, arrow = arrow(length = unit(0.5, "cm"))) +
  geom_segment(aes(alpha=arrow4), x=3.2, xend=1.8, y=3, yend=3, size = 1, arrow = arrow(length = unit(0.5, "cm"))) +

  # control alpha
  scale_alpha_continuous(range=c(0,1)) +

  # Barplot money (y=ax + b avec a=(yb-ya)/(xb-xa) et b=y-ax at a given point)
  geom_segment(x=1, xend=1, y=-1, aes(yend=(0-(-0.8)/(500-200))*tot-1.33), color="yellow", size=22, alpha=0.7) +
  geom_segment(x=4, xend=4, y=-1, aes(yend=(0-(-0.8)/(500-200))*tot_crypto-1.33), color="yellow", size=22, alpha=0.7) +

  # Total
  geom_text( x=1, y=-.5, label="Total Euro", color="grey", size=5) +
  geom_text( x=4, y=-.5, label="Total Crypto", color="grey", size=5) +
  geom_text( x=1, y=-.8, aes(label=round(tot,0)), color="grey", size=5) +
  geom_text( x=4, y=-.8, aes(label=round(tot_crypto,0)), color="grey", size=5) +

  # Money
  geom_label( x=1, y=4, label="Euro", color="black", size=5) +
  geom_label( x=4, y=4, label="Crypto", color="black", size=5) +


  # Limits
  xlim(-2,5) +
  ylim(-1,4)

gganimate(p, interval = .2, title_frame = F, filename="IMG/arbitrage.gif")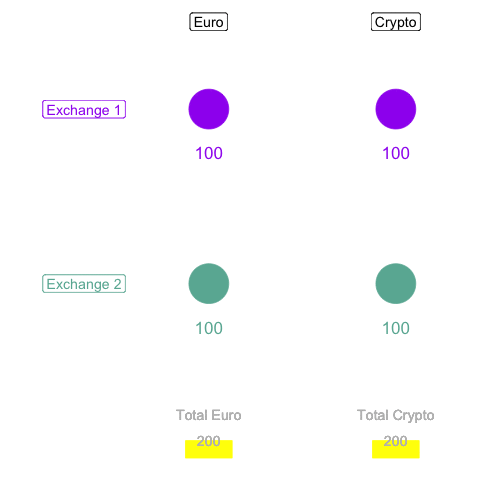
Litterature
Several methods of arbitrage exist and I’m far from being the only one trying to do it. Here is a selection of a few really promising project that are worth visiting:
- CryptoArbitrager: use the fact that the evolution of different currencies are strongly correlated. Sometimes a delay is observed, what is an arbitrage opportunity.
- Blackbird: has the advantage of being Market neutral: no loss if the global price of the currency drop down.
- R2
- Peregrine
Next step
The next step simulates an arbitrage algorithm on a 2 weeks period to assess the potential gain.
A work by Yan Holtz for data-to-viz.com